
Geographic Concentration: Location As a Workers’ Compensation Variable
Reni Snider, Senior Account Executive, Libertate Insurance

Two Professional Employer Organizations each generate $100 million in workers’ compensation payroll.
They operate in the same class codes and maintain similar class code distributions. They may even have comparable historical loss ratios.
These organizations can appear remarkably similar, yet their future risk characteristics may be materially different.
Why?
Because where work occurs can tell us something that what work is being performed cannot.
As workers’ compensation underwriting continues its evolution toward increasingly sophisticated predictive models, geography is receiving renewed attention. Not because geography is new, but because our ability to analyze it has changed dramatically.
And like every variable discussed throughout this series, geography must ultimately earn its place through evidence, not intuition.
The question is not whether geography matters. The question is how.
Our Ability to Examine Geography Is Changing.
Workers’ compensation has always been influenced by geography.
State statutes, medical environments, benefit structures, climate and regulatory systems differ. Underwriters have always considered these realities.
What is changing is the ability to combine increasingly granular geographic information with payroll, classification, claims, tenure, hiring velocity, demographics and other datasets.
Rather than asking only:
What states does this organization operate in?
We can increasingly ask:
What characteristics exist within those locations, how are they changing, and do they help predict future loss performance?
This reflects a recurring theme throughout this series. Advances in technology do not change the scientific method. They allow us to ask better questions.
More data does not automatically create better answers. Every variable must still demonstrate predictive value.
The principle remains exactly the same:
New tools. New questions. Same scientific process.
Geography Is Often a Container for Other Variables
Geography itself does not cause injuries. People do not become injured because a state appears on a map.
What geography often captures is a collection of conditions under which work occurs: workforce demographics and tenure; wages and labor availability; hiring velocity and population movement; healthcare and provider access; regulatory and benefit structures; industry concentration; and climate and economic conditions.
Viewed this way, geography becomes less interesting as an isolated variable and more interesting as a lens through which other variables can be understood.
A concentration of payroll in a particular region may be less important than the workforce characteristics that accompany that concentration.
The location becomes part of the story rather than the entire story.
The Same Class Code Does Not Always Mean Precisely the Same Exposure
Identical class-code distributions do not necessarily establish identical operational exposures.
Classification systems vary across jurisdictions. Phraseology, inclusions and exclusions may differ, and activities contemplated within a classification in one state may be treated differently elsewhere. Snow removal, tree trimming, landscaping and related operations provide common examples of exposures whose classification treatment can vary by jurisdiction and bureau.
The broader underwriting lesson is more important than any individual class code example.
A payroll concentration in one state may represent somewhat different operational exposure than the same concentration in another, even when the classifications appear identical on paper.
For underwriting purposes, geography can influence both the workforce and how the operations of that workforce are classified and interpreted within the applicable jurisdiction.
Population Migration Can Change a Portfolio Without Anyone Intending It
Some of the most significant shifts occurring in workers’ compensation today are being driven by demographic and population trends.
At its 2026 Annual Insights Symposium, NCCI specifically identified population shifts, aging demographics and migration patterns among the forces influencing labor-force participation and workplace injury patterns. NCCI also pointed to slowing U.S. population growth as a constraint on future labor-force growth.
The significance for workers’ compensation is not that migration itself necessarily causes losses. It is that the population underlying the workforce is moving and changing, redistributing employees, industries and economic activity across geographic markets.
Recent U.S. Census Bureau estimates demonstrate the scale of that movement. Between July 2024 and July 2025, the United States added approximately 1.8 million residents, but growth was distributed unevenly. Texas added approximately 391,000 residents, Florida 197,000, North Carolina 146,000 and Georgia 99,000. Together, those four states accounted for more than 830,000 additional residents in a single year.
The sources of that growth also differed. Florida recorded the nation’s largest net international migration gain, approximately 178,700 residents, while states including North Carolina and South Carolina experienced substantial gains associated with domestic migration.
These movements do not establish a causal relationship with workers’ compensation performance. They establish something more fundamental to this discussion: the population from which American businesses draw their workforces is being meaningfully redistributed across geographic markets.
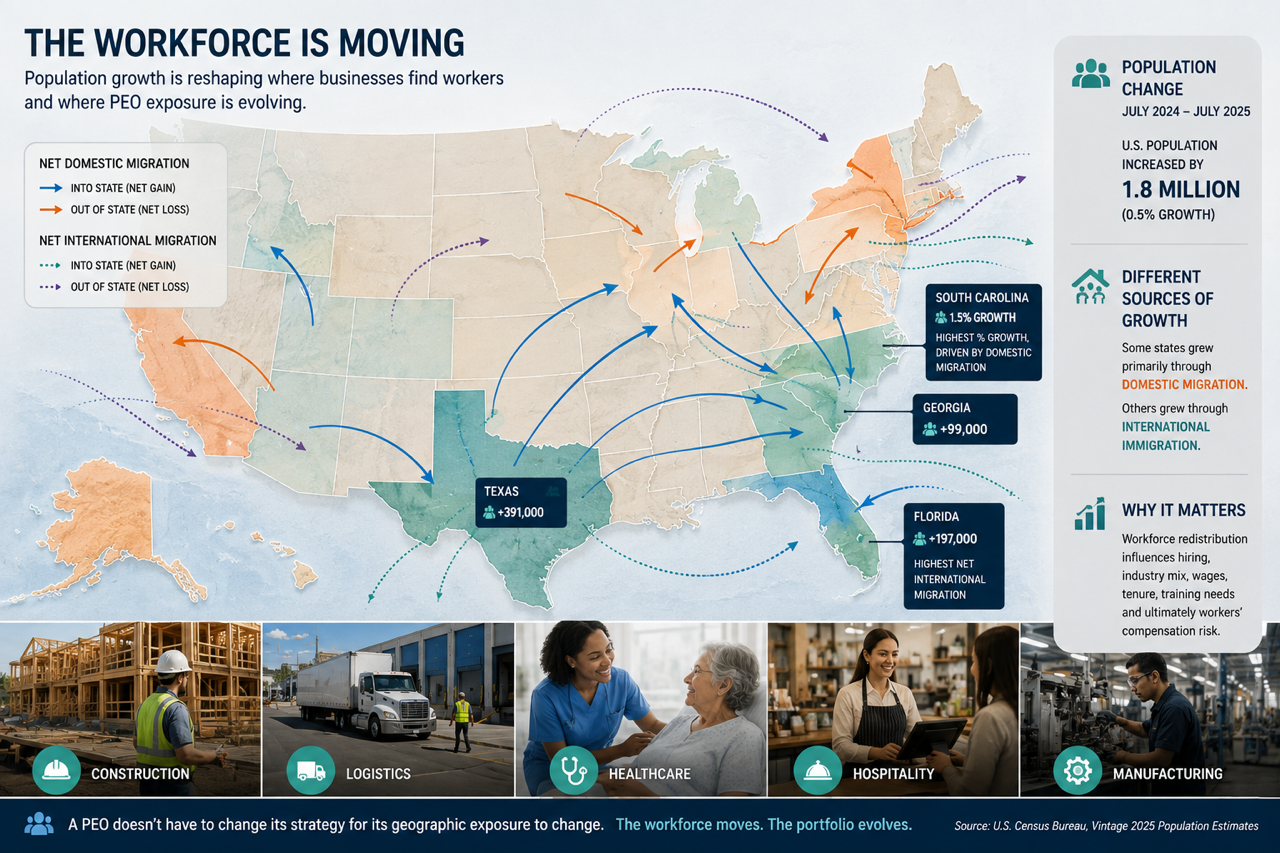
A PEO does not need to announce a new geographic strategy for its footprint to change. Existing clients grow where labor is available. New clients emerge in growing markets. Workers follow opportunity.
The underlying portfolio evolves.
That evolution can simultaneously alter workforce demographics, hiring velocity, tenure, wages, occupational composition and training demands.
Movement May Be More Important Than the Ending Number
Consider two observations:
Forty percent of payroll is located in Texas.
Now consider:
Texas represented 22%, then 27%, then 34%, and now 40% of payroll over four consecutive years.
Those statements are not necessarily equivalent.
The second contains information about direction. It may indicate rapid expansion, emerging concentration, hiring pressure, industry migration, regional economic growth or changing client composition.
Static measurements describe conditions.
Movement describes change.
As discussed previously in our Hiring Velocity article, sometimes the rate of change tells us something the ending value cannot.
Geography Influences What Happens After an Injury Occurs
Once an injury occurs, location can significantly influence what happens next.
Statutory benefit schedules, maximum and minimum indemnity benefits, medical fee schedules, provider and specialist access, attorney involvement, rehabilitation availability and return-to-work resources can all differ geographically.
Workers’ compensation research provides considerable evidence that claim costs and development differ across jurisdictions. WCRI’s 2026 CompScope Benchmarks compare workers’ compensation performance across 18 states, examining differences in total costs per claim, medical payments, income benefits, benefit utilization, temporary disability duration and benefit delivery expenses.
WCRI found that total workers’ compensation claim costs increased by an average of 6 percent annually from 2022 through 2025 in the median study state, but the underlying drivers varied across jurisdictions. Medical payments, wages, disability duration, benefit structures and system administration can each influence how costs develop.
NCCI has identified geographic variation even within individual states. Its analysis of Florida, Illinois and Texas found regional differences in workers’ compensation claim frequency, severity and overall costs. NCCI identified factors including population, employment, industry and injury mix, compensability and benefit structures, treatment guidelines, medical fee schedules and attorney involvement.
As a result, two remarkably similar injuries can follow very different development paths.
The injury itself may be nearly identical.
The recovery environment may not be.
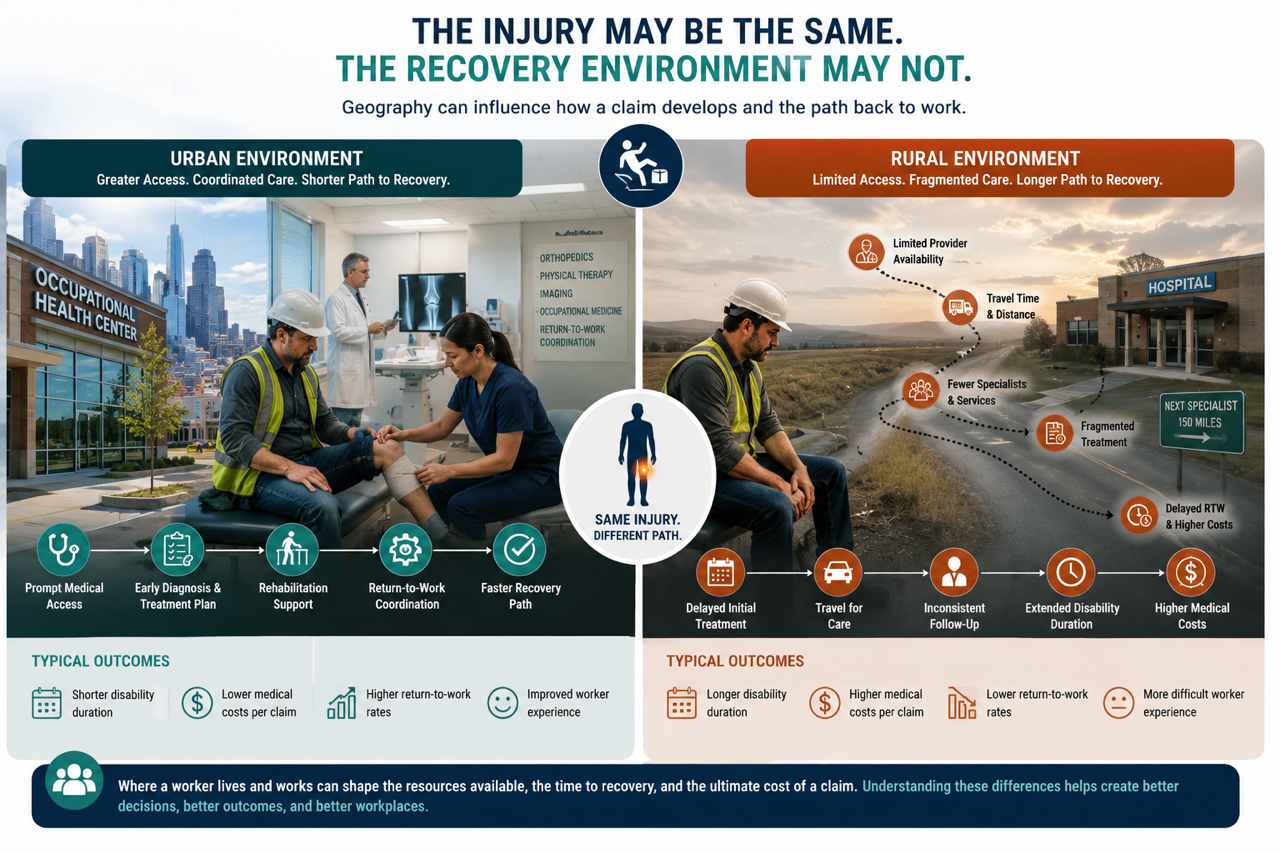
Geography can therefore influence both the probability of loss and the trajectory of loss after it occurs.
Geography Operates at Multiple Levels
State-level analysis is often where geographic discussions begin. Increasingly, it is not where they end.
Organizations can examine concentration at the state, metropolitan, county, ZIP code, client-location and individual-worksite levels.
A portfolio that appears diversified across a state may actually be concentrated within a handful of metropolitan areas. Conversely, a portfolio heavily concentrated in one state may contain substantial internal diversification.
Technological advances increasingly allow these patterns to be measured, but they also require discipline.
Smaller datasets can create the illusion of precision. Not every observed pattern represents a meaningful relationship.
Granularity is not the same thing as credibility.
Concentration Is Neither Good Nor Bad
One of the easiest mistakes in risk analysis is assuming concentration automatically signals danger.
Geographic concentration can also create meaningful advantages: deep local market knowledge, established provider and claims networks, specialized loss-control resources, greater understanding of local industries and more efficient deployment of safety initiatives.
The presence of concentration is rarely the most important question.
The more interesting question is:
What risks—and what advantages—are concentrated with it?
Why Geography Is Especially Interesting in the PEO Model
PEOs create a particularly fascinating environment for geographic analysis.
A single PEO may represent hundreds or thousands of employers. New clients arrive. Existing clients grow. Others terminate. The geographic footprint is constantly changing.
A statewide payroll summary can conceal substantial movement underneath the surface.
That creates opportunities to examine geographic payroll growth, client density, regional hiring velocity, loss frequency and severity by geography, interactions between class code and location, demographic patterns and geographic movement over time.
The conversation begins with:
Where is the exposure?
Increasingly, it may evolve into:
Where is the exposure going?
Geography Looks Different Under a Master Policy Than Under an MCP
For PEOs, geographic concentration cannot be considered entirely separately from policy structure.
The same geographic distribution can look different depending on whether workers’ compensation coverage is written through a Master Policy or a Multiple Coordinated Policy (MCP) structure.
Under a Master Policy, the exposures and loss experience of participating client companies are brought together within a common policy structure. Concentrations that appear relatively small at the individual client level can become meaningful when viewed across the aggregate PEO master.
An MCP preserves considerably more client-level separation. Individual client companies maintain coordinated policies with their own payroll, classifications and loss experience, providing greater client-level visibility into geographic characteristics.
Neither structure eliminates geographic risk.
It changes the lens through which that risk is viewed.
That distinction becomes increasingly important when a PEO operates across multiple states.
Workers’ compensation remains fundamentally jurisdictional. States can differ in benefit structures, classification rules, experience-rating treatment and regulatory requirements. A multistate PEO likely has exposure governed by NCCI in some states and independent workers’ compensation rating bureaus or other state-specific systems in others.
The same national PEO can consequently operate within several workers’ compensation ecosystems simultaneously.
Geography therefore becomes more than a question of where payroll is located. It can also influence which rules govern that payroll, how classifications are applied, how experience develops and is reflected in experience modification, and how individual client experience is represented within the broader PEO program.
For PEO underwriters, the question is not simply:
Where is the exposure concentrated?
It is also:
How does the policy structure and governing jurisdiction change what that concentration means?
Better Information Should Lead to Better Outcomes
The ability to analyze geographic exposure with greater precision represents another step in the continuing evolution of workers’ compensation underwriting.
But greater precision comes with greater responsibility.
More variables do not automatically create better models. More data does not eliminate uncertainty. And increasingly sophisticated technology does not eliminate actuarial judgment.
We still observe, ask questions, test relationships, challenge assumptions and determine which variables carry meaningful predictive value and which merely create statistical noise.
Geography deserves exactly that treatment.
The objective is not to prove that location predicts workers’ compensation performance. It is to understand when geography provides meaningful information and what we can do with that knowledge.
If geographic analysis identifies an emerging concentration of inexperienced workers, training resources might be deployed sooner.
If it reveals limited access to occupational medicine, stronger provider networks might be developed.
If population patterns signal rapid workforce expansion, safety and onboarding resources might arrive before claims experience tells us they were needed.
And if geography helps explain why otherwise similar claims develop differently, that knowledge might improve claims management and return-to-work strategies.
That is where increasingly predictive workers’ compensation analytics become most valuable.
Not simply when they help us understand what risk may cost, but when they help us understand why the risk exists and what we might do about it.
Throughout this series, we have progressively added context to traditional measures of workers’ compensation exposure.
Payroll tells us how much work is being performed.
Classification helps tell us what work is being performed.
Wages, tenure, hiring velocity and demographics tell us more about the people performing it.
Geography adds another dimension:
Where is the work being performed, and what does that location tell us about the environment surrounding it?
None tells the whole story independently. Together, they give us an increasingly detailed picture of the workforce behind historical loss experience.
And that is the opportunity created by better data, greater computing power and more sophisticated analytical tools: not simply to predict losses more accurately, but to recognize risk early enough to change outcomes.
The destination should be bigger than better underwriting.
It should be safer workplaces. Better recoveries. More effective return-to-work programs. Healthier employees. Stronger businesses.
Safer, happier, healthier working environments for all.
And with that, the focus of this series begins to shift.
We have spent the last several articles examining the workforce behind the claims.
Next, we will examine the claims themselves.
Because if the characteristics of a workforce can provide clues about future risk, the way its claims develop over time may have quite a bit to tell us as well.