
Claims Development Patterns: A Claim Is Not a Number. It Is a Trajectory.
Reni Snider, Senior Account Executive, Libertate Insurance
Workers’ compensation underwriting has always depended heavily upon historical loss information.
Paid losses. Outstanding reserves. Total incurred losses. Claim counts. Loss ratios. Experience modification factors.
These numbers are fundamental to understanding risk.
But there is something important hidden inside almost every loss run:
The numbers are still moving.
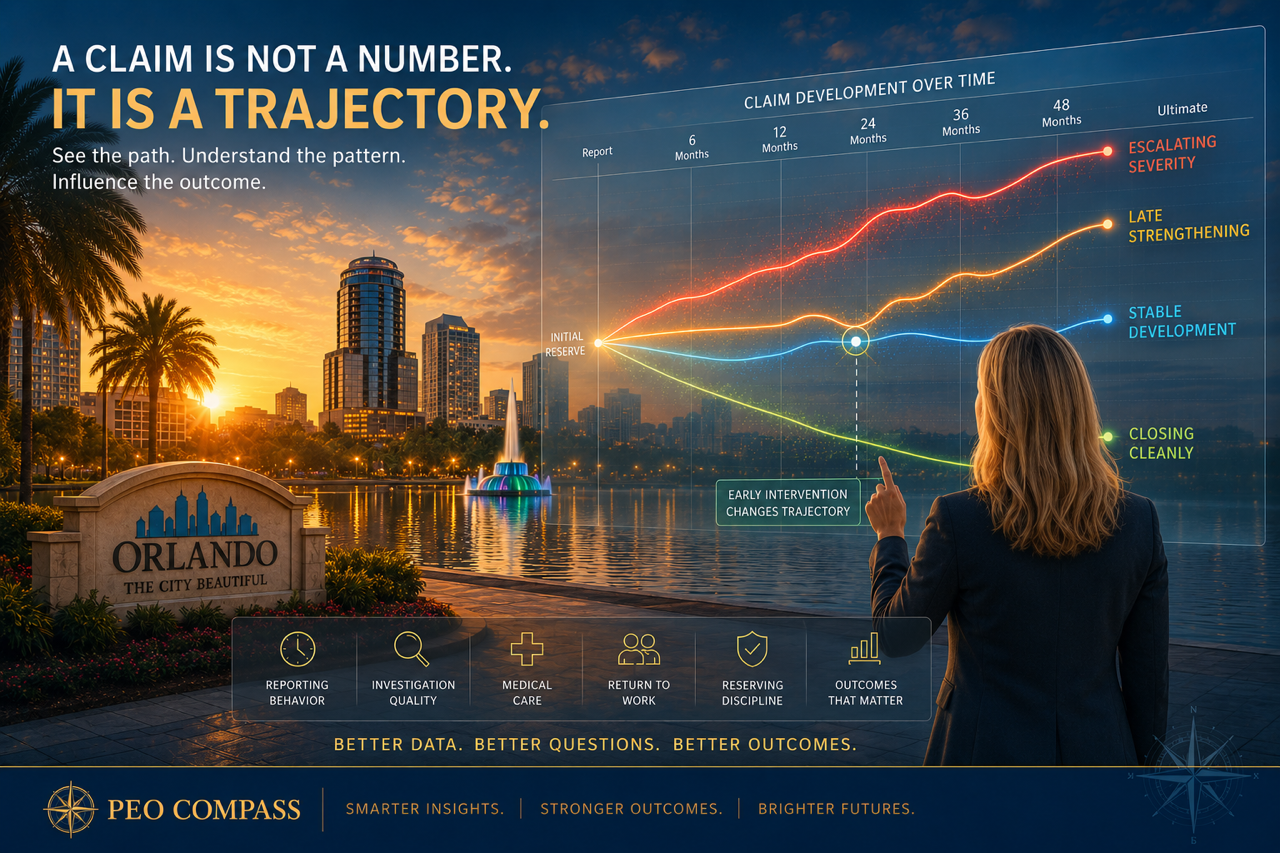
A workers’ compensation claim is not a static number. It is a trajectory.
A claim valued at $50,000 today may ultimately close at $35,000. Another claim valued at the same $50,000 may ultimately cost $175,000. At a particular moment, those claims may look identical on a loss run even though they are traveling toward very different destinations.
That creates an important opportunity.
We can ask:
How much has this organization lost?
And we can ask:
How do this organization’s claims behave after they occur?
Historical losses tell us what happened.
Claims development can tell us something more: how an organization responds after something happens.
A Claim Changes as Information Changes
Every workers’ compensation claim begins with incomplete information.
An employee is injured. The injury is reported. An adjuster investigates, evaluates compensability, establishes an initial reserve and begins coordinating benefits.
But on day one, nobody knows everything that will eventually be known about that claim.
The diagnosis may change. Conservative treatment may fail. Surgery may become necessary. Disability may last longer than anticipated. An attorney may become involved. Modified duty may become available—or disappear. A claim expected to close may remain open. A closed claim may reopen.
As information changes, the financial estimate changes with it.
Several terms commonly appearing on a loss run describe different pieces of this evolving picture.
Paid loss represents dollars already paid.
Outstanding case reserves represent the current estimate of additional dollars expected to be paid.
Total incurred loss generally combines the two.
Ultimate loss represents what the claim or group of claims is ultimately expected to cost after development is complete.
And loss development describes the movement between those points as claims mature.
The younger—or more raw—a group of claims is, the more uncertainty generally remains.
None of this is new.
Actuaries have modeled loss development for generations. What is changing is our ability to examine that development at increasingly granular levels and connect it with other information about the claim, employer, workforce and claims-management environment.
That is consistent with a theme I explored earlier in this series in The Evolution of Actuarial Science: New Tools, New Questions, Same Scientific Method.
The science is not being replaced.
The instruments are getting better.
The Same Loss Ratio Can Hide Two Very Different Programs
Consider two hypothetical PEO workers’ compensation programs.
Both have comparable payroll and occupational mix. Their claim frequency is similar. At an early valuation, both report approximately the same incurred loss ratio.
On an underwriting spreadsheet, they may initially appear remarkably similar.
But underneath those numbers, something very different may be happening.
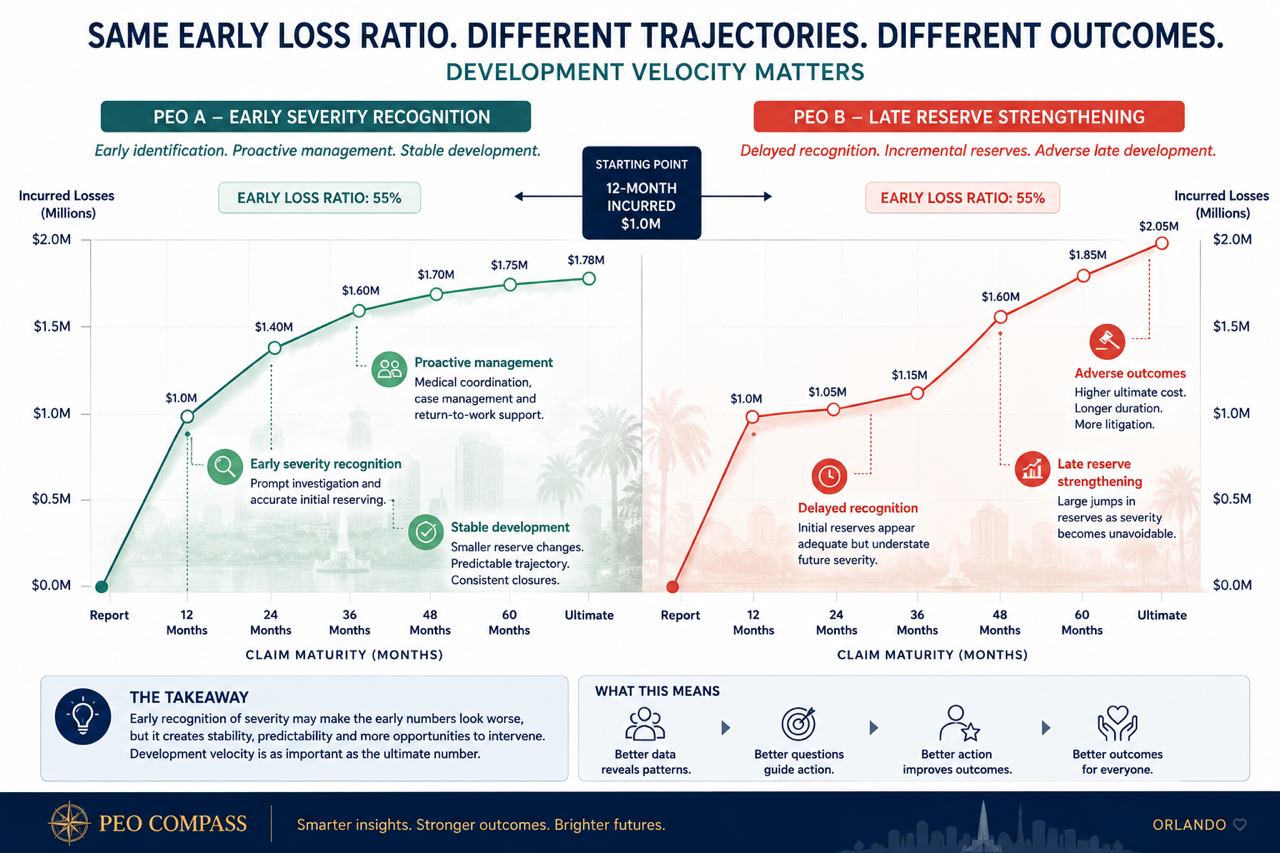
PEO A reports injuries promptly. Claims receive early investigation. Initial reserves respond reasonably to known severity. Medical care is coordinated. Complex claims are escalated. Transitional duty is available. The PEO claims team participates in regular reviews with the carrier and third-party administrator. Claims close consistently, with relatively limited late reserve escalation.
PEO B experiences reporting delays. Early investigation is inconsistent. Initial reserves frequently prove inadequate. Medical coordination is slower. Return-to-work opportunities are limited. Claims remain open longer, litigation is more common, and significant reserve strengthening occurs at later valuations.
At six months, these programs might look similar.
At 24 or 36 months, they may look nothing alike.
Over enough claims and enough time, those differences can begin to create what might be thought of as a claims-development fingerprint.
That fingerprint does not necessarily tell us why the difference exists. Claims are influenced by occupation, injury type, jurisdiction, workforce characteristics, medical environment and countless other variables.
But it tells us where to start asking questions.
Loss Development Triangles: How Actuaries See Time
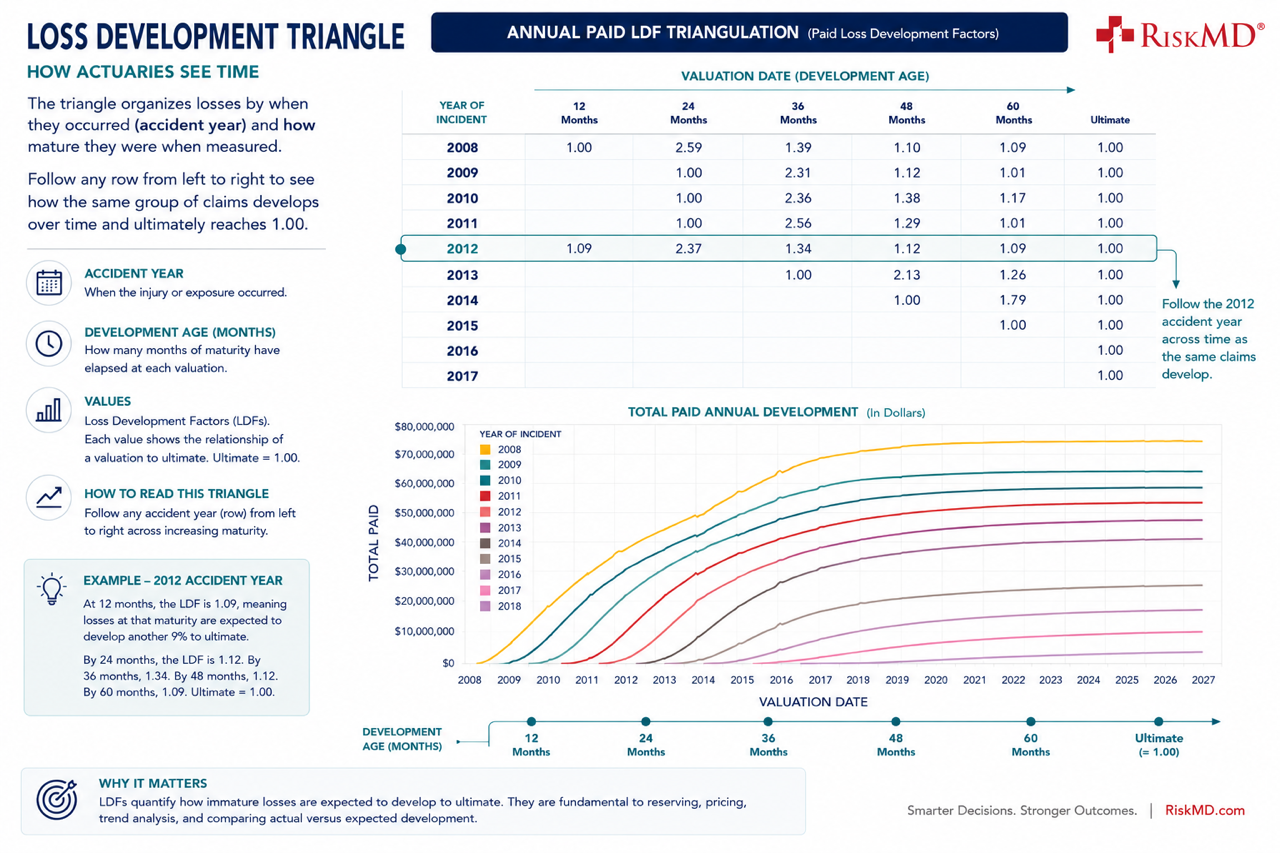
One of the foundational actuarial tools for understanding this movement is the loss development triangle.
Despite the intimidating name—and occasionally intimidating spreadsheet—the concept is fairly intuitive.
A loss development triangle organizes groups of claims across two dimensions: when the losses occurred and how mature those losses were when measured.
Imagine examining the same accident year at 12, 24, 36 and 48 months.
At each valuation, the claims have had more time to develop. Medical bills have been paid. Employees have returned to work. Some claims have closed. Others have deteriorated. Reserves have been increased or released. Litigation has emerged or resolved.
By comparing successive valuations across historical periods, actuaries can observe relationships between earlier and later loss values.
Those relationships form the basis for Loss Development Factors, or LDFs.
An LDF helps estimate what immature losses may ultimately become.
For example, $10 million of incurred losses today does not necessarily mean an accident year will ultimately cost $10 million. If historical experience indicates claims at that maturity typically develop further, that relationship can help estimate ultimate losses.
Development patterns therefore influence reserving, pricing, trend analysis, program evaluation and comparisons between actual and expected performance.
They also demonstrate why the age of loss information matters.
A dollar of incurred loss at 12 months is not necessarily informationally equivalent to a dollar of incurred loss at 60 months.
This is where modern analytics can extend a very old actuarial concept.
Loss triangles are not new.
Loss Development Factors are not new.
Estimating ultimate losses is not new.
Traditionally, we might have asked:
How does this book of business develop?
Increasingly, we can ask:
Which claims, employers, industries, geographies, workforce characteristics, reporting behaviors and claims-management practices are associated with different development trajectories?
The traditional triangle tells us what developed.
Richer datasets may increasingly help us investigate why it developed that way.
Same scientific method.
Better instruments.
Better questions.
You Can Learn Quite a Lot From an Ordinary Loss Run
There is a temptation when discussing predictive analytics to leap immediately to artificial intelligence, machine learning and enormous proprietary datasets.
Those tools have extraordinary potential, but sophisticated questions do not always require sophisticated data.
Relatively ordinary carrier loss information can support measurements such as reporting lag, claim frequency, average paid and incurred cost, open-claim and closure rates, average age of open claims, paid-to-incurred ratios, reserve-to-incurred ratios, medical versus indemnity mix, and lost-time versus medical-only distributions.
Losses can also be segmented by state, class code, client company, injury type or other available characteristics.
Large-loss concentration can reveal what percentage of total incurred loss is attributable to the largest five, ten or twenty claims.
Where historical valuations have been retained, the analysis becomes even more interesting.
How much did incurred losses change between 12 and 24 months? How frequently were reserves changed? How large were those changes? Which clients repeatedly experienced greater-than-expected development? How did actual development compare with expected development?
Most of these calculations require neither artificial intelligence nor extraordinary computing power.
Modern analytical tools become powerful when they allow many variables to be evaluated simultaneously across large populations.
The opportunity is not simply to create more metrics.
It is to discover relationships between them.
Claims Development Becomes Data
Once claims are observed through time rather than at a single valuation, development itself becomes another measurable characteristic of the workers’ compensation program.
Potential variables include days from injury to reporting, initial incurred estimates, reserve changes at various maturities, percentage of claims remaining open at six, 12 and 24 months, medical versus indemnity development, disability duration, attorney involvement, return-to-work timing, reopening, closure velocity, and development by employer, industry, class code, geography, carrier or TPA.
Where sample sizes are sufficiently credible, analysis could extend even further into individual claims units or adjuster populations.
Suddenly, the claim is no longer represented only by its current incurred value.
It has a history.
And that history can be measured.
The Human System Behind the Numbers
This becomes especially interesting in the PEO environment because PEOs can have unusually involved relationships with the claims organizations administering their workers’ compensation programs.
A sophisticated PEO risk team may maintain special handling protocols with adjusters and participate in claims reviews, large-loss reviews, reserve discussions, escalation protocols, litigation strategy, settlement discussions, nurse case-management referrals, medical management, subrogation and return-to-work coordination.
The PEO may also intervene directly with the client company when communication, modified duty or other employer-level action is necessary.
Claims management can therefore become an active risk-management function rather than an administrative process occurring somewhere inside the carrier.
That matters because a workers’ compensation claim reflects more than the injury itself.
It can also reflect what happens after the injury.
TPA and carrier philosophy matter. Adjuster experience and caseload can matter. Supervisor involvement, medical management, litigation strategy, settlement authority and escalation procedures can matter.
And reserving philosophy can matter tremendously when interpreting what the numbers are telling us.
Reserving Practices Are Themselves a Variable
A reserve is an estimate of future claim cost based upon the information available at a given point in time.
Different carriers, TPAs, claims units and adjusters may approach that estimate differently.
Some claims organizations recognize anticipated severity relatively early. Others increase reserves more incrementally as information emerges.
That creates an important analytical trap:
Higher initial incurred losses do not necessarily indicate worse claims performance.
Imagine two TPAs handling otherwise comparable claims.
The first recognizes probable severity early and establishes relatively robust reserves.
The second establishes lower initial reserves but repeatedly strengthens them as claims mature.
At an early valuation, the second TPA may appear to be producing better results—even a more attractive immature loss ratio.
Several years later, however, the picture can reverse.
The first population may show relatively stable development because anticipated severity was recognized early. The second may experience substantial adverse development as earlier reserve estimates prove inadequate.
Observed development can therefore reflect at least three things:
A genuine change in the underlying claim.
New information becoming available.
A change in how the claim is being adjudicated or reserved.
Understanding the difference is critical.
Initial reserve adequacy, the frequency and magnitude of reserve changes, timing of reserve strengthening, paid-to-incurred relationships and large-loss escalation practices can all provide context.
Carrier and TPA transitions deserve particular attention. If development patterns suddenly change, did claim performance change—or did the philosophy used to evaluate and reserve those claims change?
More data does not eliminate the need for professional judgment.
Sometimes it makes judgment even more important.
How Quickly Does Bad News Become Known?
This leads to a particularly useful concept: development velocity.
Not all adverse development indicates poor claims management.
Sometimes a serious claim is simply a serious claim.
But the timing and consistency with which severity becomes visible can itself be informative.
How quickly are serious claims identified?
Are initial reserves routinely inadequate?
Does deterioration emerge gradually or through large late jumps?
Are reserves repeatedly strengthened at predictable maturity points?
Are certain clients responsible for disproportionate late development?
Does the pattern change following attorney involvement?
Early recognition of bad news can be preferable to delayed recognition—even though it makes early numbers look worse.
A mature analytical framework therefore needs to distinguish between recognizing a bad outcome earlier and creating a bad outcome.
Those are not the same thing.
Claims Development Can Become an Operational Signal
Development patterns can also become clues about the operating environment surrounding claims.
Persistent late development might be associated with delayed reporting, weak investigation, ineffective medical direction, limited transitional duty, fragmented communication, poor reserve discipline or inadequate escalation procedures.
More stable development might be associated with prompt reporting, rapid triage, appropriate medical care, active claims oversight, effective reserving and earlier identification of complex claims.
But an important warning belongs here:
Correlation is not causation.
A roofing contractor and an accounting firm should not be expected to produce identical claims-development patterns. Neither should workforces operating under materially different state benefit systems, occupational hazards, wage structures or medical environments.
The goal is not to observe that two populations develop differently and immediately declare one better managed.
The goal is to control for characteristics we already know are different and determine whether meaningful differences remain.
That brings claims development directly back to the variables explored throughout this series.
Employee age. Employee tenure. Hiring velocity. Wage level. Industry. Class code. Geography. State workers’ compensation systems.
The variables do not exist independently. They interact.
Frequency Is Only the Beginning of the Story
Current workers’ compensation results provide an interesting backdrop.
NCCI reported that lost-time claim frequency declined another 2% in 2025, continuing the industry’s long-running frequency decline, although at a slower pace than the historical average. At the same time, both medical and indemnity claim severity increased approximately 4%.
NCCI also estimated a 2025 calendar-year combined ratio of 91%, compared with a 102% accident-year combined ratio. Prior accident years continued to experience favorable reserve development.
That distinction matters.
Workers’ compensation results do not belong exclusively to the year in which we happen to measure them. Claims from earlier years continue to develop, and changes in those estimates continue to influence current financial results.
The Bureau of Labor Statistics reported approximately 2.5 million nonfatal workplace injuries and illnesses among private-industry employers in 2024. Across 2023–2024, approximately 1.8 million cases involved days away from work, with a median of eight days away. Another 1.1 million involved job transfer or restriction, with a median duration of 15 days.
Those numbers provide scale.
But counting claims tells us primarily about frequency.
Following those claims through time reveals severity, duration and potentially the effectiveness of the system responding to them.
Different Financing Structures. Same Need to Manage the Claim.
The financial consequences of claims development are most obvious in loss-sensitive workers’ compensation programs.
A PEO operating through a large deductible, retrospective rating plan, captive, self-insured structure or another risk-sharing arrangement can feel deteriorating claims directly through deductible reimbursement, collateral, loss funds, retrospective premium, captive profitability, cash flow and ultimate program cost.
Claims management under those structures is therefore inseparable from financial management.
But claims performance is no less important under guaranteed cost.
The economics are simply different.
Under guaranteed cost, the carrier may bear the immediate claim dollars. But deteriorating experience can eventually affect renewal pricing, carrier appetite, underwriting credibility, experience modification, client-level pricing, capacity, available program structures and negotiating leverage.
It may influence whether a carrier will expand with the PEO, whether competing markets find the account attractive and whether loss-sensitive alternatives become viable in the future.
A guaranteed-cost PEO therefore cannot simply conclude that the carrier owns the losses.
The carrier may own the immediate claim dollars, but the PEO owns the loss history those dollars create.
The PEO Has an Unusual Analytical Advantage
An individual small or midsized employer often lacks enough claims to identify statistically meaningful patterns in its own experience.
Consider a 40-employee plumbing contractor.
Even over several years, that employer may produce too few significant claims to determine whether its claims systematically remain open longer than expected or develop differently from comparable organizations.
A PEO may represent hundreds of similar employers.
Across that population, it may be possible to compare similar industries, class codes, payroll sizes, states and workforce characteristics while observing differences in reporting behavior, litigation, claim duration, reserve development, closure and ultimate severity.
That makes the PEO environment something of a natural laboratory for claims-performance analysis.
Instead of asking whether one plumbing contractor’s four claims happened to develop poorly, we may eventually ask how hundreds of plumbing contractors behave across thousands of claims—and what characteristics distinguish better-performing populations.
Scale creates analytical possibilities individual small employers simply do not possess.
But Data Architecture Matters
Scale alone is not enough.
As discussed in the previous installment of this series, PEO workers’ compensation programs can operate through different policy structures, including master policies and multiple coordinated policies.
Claims may span different carriers, TPAs, states and policy periods.
That creates practical questions.
Can every claim consistently be linked to the correct client company? Are valuation dates consistent? Can development be compared across policy structures? Did a carrier or TPA change introduce a different reserving philosophy? Are apparently different populations actually performing differently—or are we measuring them differently?
This is where enthusiasm for “big data” requires some restraint.
More data does not automatically mean better information.
Predictive analysis built upon inconsistent identifiers, incompatible valuation dates or changing methodologies can produce extraordinarily sophisticated answers to the wrong question.
Good analytics begins with good data architecture.
From Loss Development Factors to Predictive Signals
The traditional actuarial question remains enormously important:
Given historical development, what will these losses ultimately become?
But richer claims data allows another question to emerge:
Given everything currently known about this claim, employer, worker, injury, claims-management environment and historical development pattern, how likely is this claim to follow a particular trajectory?
Analytics might help identify claims likely to exceed current reserves, flag unusually slow recovery, identify anomalous reserve development, reveal clients whose claims systematically deteriorate at particular maturities or detect unexpected differences among claims-handling populations.
Most importantly, it could help prioritize where experienced human attention is most valuable.
That is the goal.
Models do not replace actuaries.
Analytics do not replace adjusters.
Algorithms do not replace underwriters.
Technology does not replace experienced risk professionals.
It gives those professionals additional instruments through which to observe risk.
Prediction Matters Most When Someone Can Do Something About It
Predicting ultimate claim cost more accurately has obvious value.
Carriers need it for reserving. Actuaries need it for ultimate-loss estimation. Underwriters need it for pricing. PEOs operating loss-sensitive programs need it for financial forecasting and collateral management.
But there may be an even more valuable application.
What if we can identify an unfavorable trajectory while there is still time to influence it?
A developing signal might prompt senior adjuster review, PEO claims-team involvement, nurse case management, physician coordination, employer outreach, modified duty, specialist referral, litigation review, settlement evaluation or simply a second look at the reserve.
Not every deteriorating claim can be changed.
Some injuries are severe because they are severe. Some workers require extensive treatment. Some claims will remain expensive regardless of how effectively they are managed.
Predictive analytics should never confuse statistical probability with individual certainty.
But if historical patterns allow experienced professionals to identify claims deserving earlier attention, the question becomes more useful than simply:
Which claims will cost more?
The question becomes:
Which claims are beginning to follow an unfavorable trajectory—and is there something we can do about it?
That is where prediction moves beyond forecasting and begins to support intervention.
And that brings us back to the broader purpose underlying this series.
Better data should support better questions.
Better questions should support better decisions.
And better decisions should ultimately support better outcomes—not simply lower loss costs, but healthier recoveries, more successful returns to productive work and safer, happier, healthier workplaces.