Workers’ Compensation Is Becoming More Predictive
Reni Snider, Senior Account Executive, Libertate Insurance
For decades, workers’ compensation underwriting has largely been an exercise in looking backward.
Underwriters examine reported payrolls, class codes, experience modifications, prior losses, and historical trends to estimate future outcomes. Those measures remain foundational to the workers’ compensation system and continue to provide valuable insight into organizational risk.
However, the industry is increasingly asking additional questions.
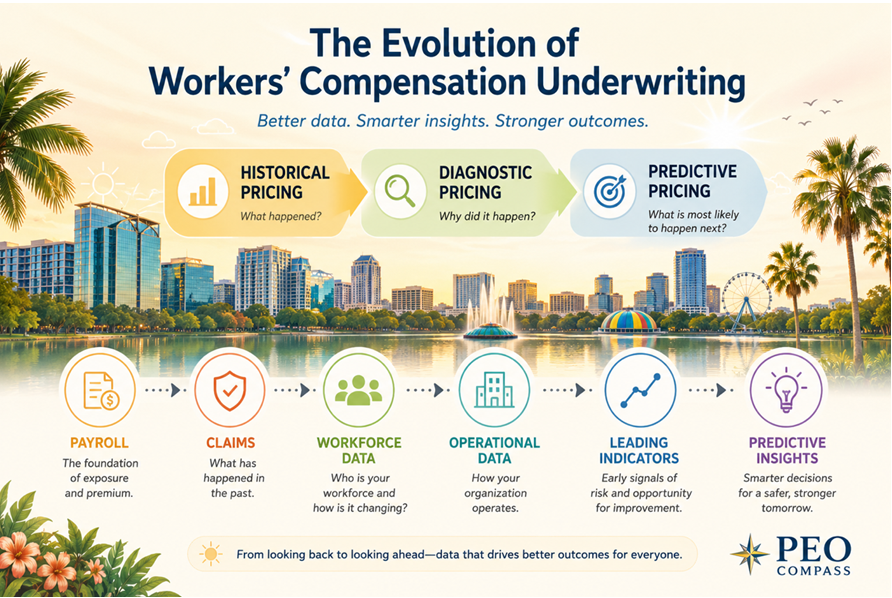
Rather than simply asking, “What happened?” underwriters are increasingly attempting to understand, “What is most likely to happen next?”
The advent of newly emerging predictive modeling tools is driving one of the most important developments in modern workers’ compensation underwriting. The industry is moving from a predominantly historical pricing model toward one that is increasingly forward looking, supported by growing volumes of increasingly granular data.
For Professional Employer Organizations (PEOs), this evolution presents both opportunities and challenges.
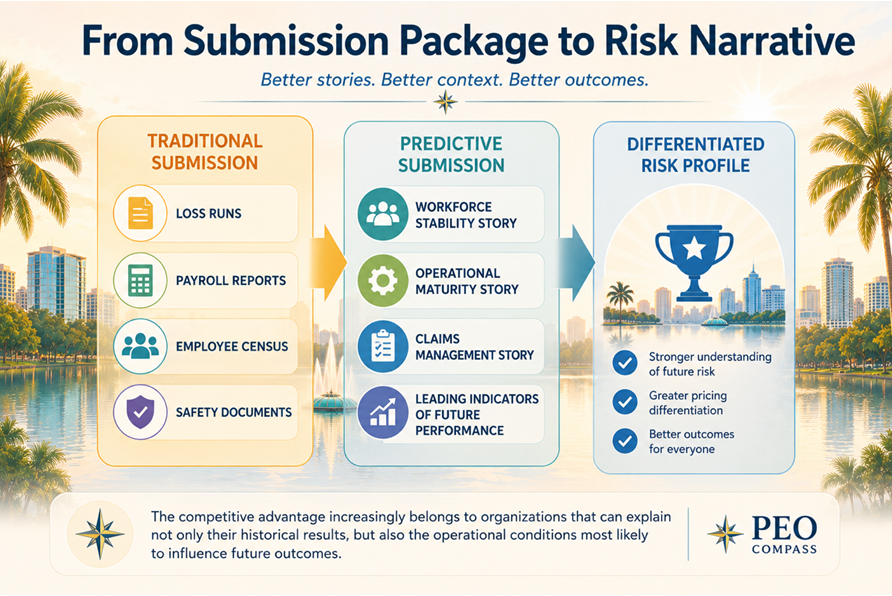
Organizations that understand what these data points actually mean and how they influence future performance will likely be better positioned to differentiate themselves in an increasingly data-driven marketplace.
More Data Does Not Necessarily Mean Better Decisions
The workers’ compensation industry has never suffered from a lack of information. Carriers, TPAs, brokers, and PEOs have long possessed enormous quantities of claims, payroll, and policy data.
The difference today is not simply that more information exists. The difference is that the information available has become increasingly granular and increasingly interconnected.
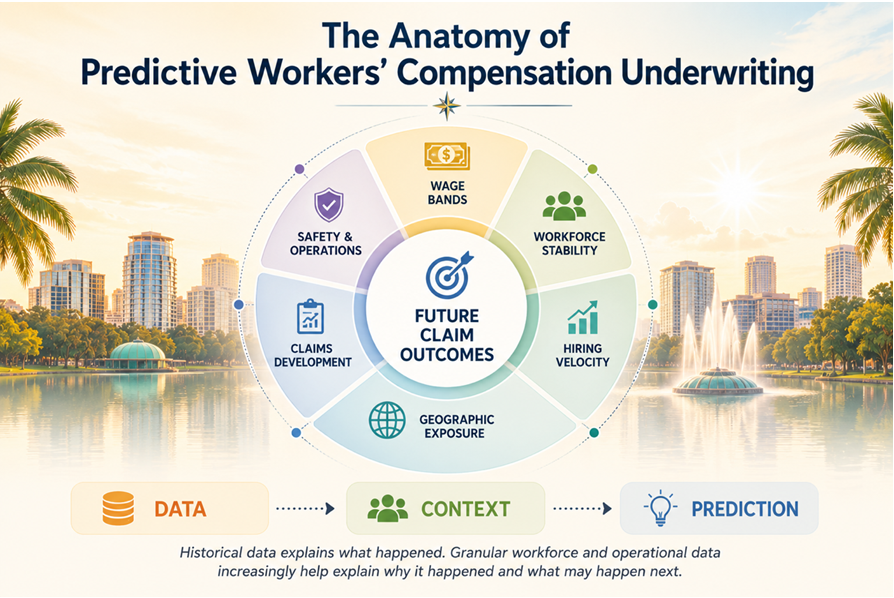
Modern analytical tools can identify relationships between variables that were difficult or impossible to measure only a few years ago. They can detect patterns, identify leading indicators, and evaluate organizational characteristics that may influence future claim outcomes.
Increasingly, underwriting is becoming less about reviewing static historical information and more about understanding the conditions that produce future losses.
This distinction matters.
Two organizations may have identical payrolls, operate within the same industry, and even possess similar experience modifications. Yet their future risk profiles may be materially different because their underlying operational characteristics differ significantly.
Granular data increasingly helps explain those differences.
Employee Wage Bands
Wage information has historically been viewed primarily as an exposure basis for premium calculation.
Increasingly, however, wage distributions provide meaningful insight into workforce composition.
PEOs frequently maintain employee-level payroll information that allows organizations to segment employees into wage bands and evaluate the percentage of employees within each compensation range.
For example, organizations may analyze:
Percentage of employees earning less than $40,000 annually
Percentage earning between $40,000 and $75,000
Percentage earning between $75,000 and $125,000
Percentage earning above $125,000
Viewed independently, wage information may appear relatively straightforward.
Viewed operationally, however, wage bands often reveal much more.
Compensation levels frequently correlate with experience, skills, workforce maturity, employee retention, and organizational stability. They may also reveal significant operational differences between organizations that otherwise appear similar from a traditional underwriting perspective.
Workforce Tenure and Retention
Employee tenure frequently serves as a proxy for organizational stability.
PEO census files often include hire dates, employment status information, and enrollment dates that allow organizations to evaluate workforce tenure characteristics.
Organizations can calculate:
Average employee tenure
Median employee tenure
Percentage of employees with less than one year of service
Percentage of employees with more than five years of service
These metrics matter because employees who remain with organizations longer generally possess greater institutional knowledge and operational familiarity.
Conversely, organizations experiencing elevated turnover frequently manage larger populations of newer employees who may be less familiar with processes, equipment, procedures, and workplace hazards.
The data does not necessarily establish causation, however, it increasingly helps identify conditions that may influence future claim outcomes.
Hiring Velocity
How quickly an organization is adding employees can also provide meaningful predictive insight.
PEOs routinely maintain monthly employee census information and payroll records that make workforce growth rates relatively easy to measure.
Organizations can evaluate:
Headcount growth rates
New hires as a percentage of total workforce
Payroll growth relative to employee growth
Seasonal hiring spikes
Rapid growth is not inherently problematic. Many high-performing organizations experience significant expansion.
However, accelerated hiring often introduces operational complexity. Training systems become stressed. Supervisors assume additional responsibilities. Larger percentages of employees become relatively new to their positions.
Underwriters increasingly recognize that the speed of organizational growth can influence future operational outcomes.
Employee Demographics and Age Distribution
Demographic characteristics also provide valuable context.
PEO census information frequently includes employee dates of birth and demographic information that allow organizations to evaluate workforce composition.
Organizations may calculate:
Average workforce age
Age-band distributions
Percentage of employees over age fifty-five
Age characteristics by classification code
Different demographic groups often exhibit different injury patterns, claim severities, recovery durations, and return-to-work outcomes.
As workforce demographics continue to evolve nationally, understanding these characteristics becomes increasingly important.
The objective is not to draw broad conclusions regarding any individual employee. Employment practices should always be performed according to the governing jurisdiction. The objective is to understand how aggregate workforce composition may influence organizational performance over time.
Geographic Concentration
Location matters in workers’ compensation.
PEOs routinely collect state payroll information and employee work location data that make geographic analysis increasingly accessible.
Organizations can evaluate a number of meaningful metrics.
Percentage of payroll by state
Percentage of employees by state
Payroll concentration ratios
Geographic diversification measures
These metrics are important because workers’ compensation systems vary considerably across jurisdictions.
Medical costs differ. Benefit structures differ. Litigation environments differ. Regulatory frameworks differ.
Two organizations with identical operations may experience substantially different outcomes simply because their workforces are concentrated in different jurisdictions. Understanding geographic concentration allows underwriters to better appreciate the operational environment in which risks actually exist.
Claims Development Patterns
Historical losses remain essential.
However, increasingly sophisticated analysis focuses not simply on ultimate outcomes but on how claims evolve over time, especially as claim patterns continue to evolve as societal behavior evolves.
Loss runs allow organizations to evaluate:
Paid versus incurred development
Reserve movement
Claim closure rates
Development by accident year
Frequency and severity trends
Claims development patterns often reveal emerging issues before those issues become fully reflected in traditional metrics.
An organization experiencing increasing reserve development may have operational issues that are not yet apparent through experience modifications.
Likewise, improving closure rates and favorable development trends may indicate operational improvements that historical summary statistics have not yet fully captured.
The direction of development frequently tells a story that static numbers alone cannot.
Return-to-Work Performance
Few operational processes influence workers’ compensation outcomes more directly than return-to-work execution.
PEO loss runs often provide information regarding:
Lost workdays
Temporary disability duration
Open claim duration
Medical-only versus indemnity claim percentages
Organizations can use these metrics to evaluate:
Average days away from work
Lost-time conversion ratios
Claim closure speed
Medical-only claim percentages
These measurements often reveal far more than claims management performance.
They frequently reveal organizational culture.
Organizations that successfully return injured employees to productive work often demonstrate strong communication, operational flexibility, and disciplined management processes.
In many cases, return-to-work performance represents one of the most controllable drivers of workers’ compensation severity.
Safety and Training Indicators
The presence of formal safety processes also provides meaningful predictive insight.
Submission materials frequently include:
Written safety manuals
New employee orientation procedures
Safety committee documentation
OSHA records
Safety certifications
Training schedules
While these indicators may appear qualitative, many can be measured quantitatively.
Organizations can develop scoring methodologies that evaluate:
Safety program maturity
Training frequency
Incident trends
Documentation completeness
The existence of documented safety processes does not guarantee favorable outcomes, however, organizations that consistently demonstrate operational discipline often exhibit more stable loss experience over time.
Increasingly, underwriters are attempting to measure these characteristics in a more structured and objective manner.
Industry-Specific Operational Characteristics
Class codes remain extraordinarily useful, however, they cannot explain every operational difference.
Two employers sharing the same classification code may operate in materially different ways.
Construction companies may differ according to:
Percentage of roofing operations
Project duration
Subcontractor utilization
Manufacturing operations may differ according to:
Degree of automation
Shift structures
Equipment intensity
Transportation companies may differ according to:
Fleet size
Driver tenure
Radius of operations
Healthcare organizations may differ according to:
Facility type
Patient handling exposures
Staffing models
Increasingly, underwriting seeks to understand how organizations actually operate rather than relying exclusively upon broad classification categories.
Operational details frequently explain future performance more effectively than historical labels alone.
The Future Is Increasingly Predictive
Workers’ compensation will always maintain a historical foundation.
Loss experience matters.
Experience modifications matter.
Classifications matter.
But the direction of the industry is becoming increasingly clear.
The workers’ compensation marketplace is steadily moving toward more individualized and increasingly predictive approaches to evaluating risk.
The objective is not simply to collect more information, but rather to collect better information that serves as a leading indicator of future performance.
For PEOs, this evolution creates an opportunity.
Organizations that understand their data, measure operational characteristics thoughtfully, and demonstrate disciplined execution may increasingly distinguish themselves in underwriting conversations.
Ultimately, the most important question is
“What conditions exist today that are most likely to influence what happens next?”